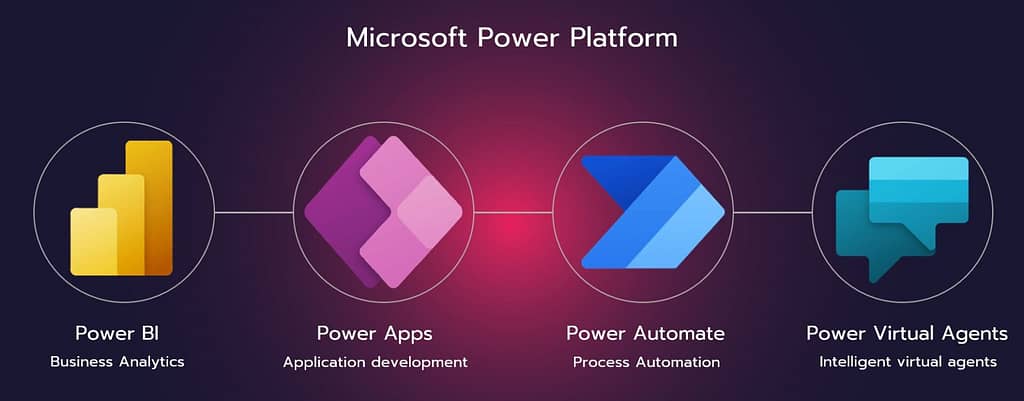
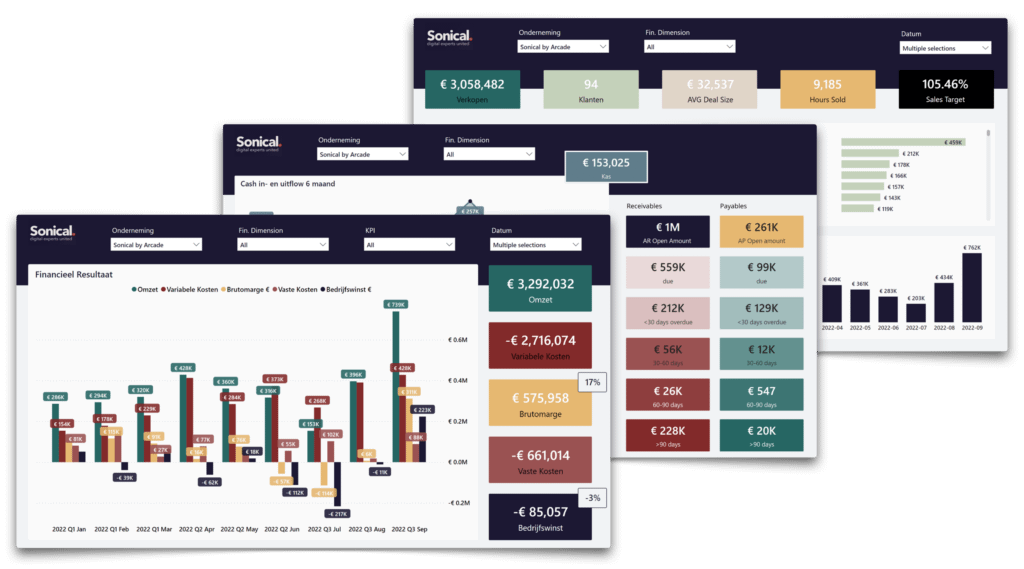
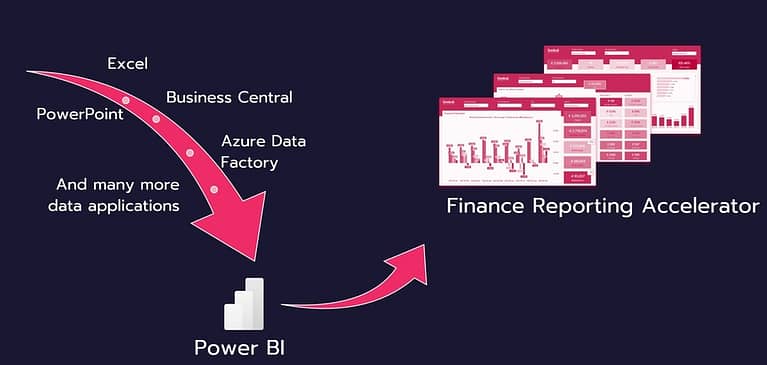
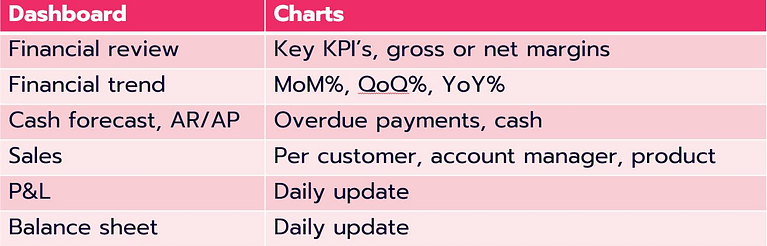
Finance Reporting Accelerator with Power BI

Financial Dashboards

Dashboards and reporting come in all shapes colors and sizes. Every company is different and so are often the reporting expectations. 

Companies often start their digital journey in Power BI by automating their financial reporting. The reason?  This data is often easily accessible within their companie.  Automating financial reporting is often where the progression in time efficiency is the greatest. As a result, these Power BI projects are paid back within as little as 18 months. A great way to do more, with less. 

As a management team you want to monitor and adjust your KPI’s at all time as the financial indicators are central to running your business. Many of the numbers and figures are published and made public to be seen by your bankers, customers, suppliers and future employees. 

A Data culture with Power BI

The change within your company to a data culture remains an ‘ongoing process’. Using Power BI will help you learn the data culture, share data with your team and gather feedback to adjust where necessary. 

The finance reporting accelerator makes it possible to lay a solid foundation within a few weeks. A foundation that can be built on for years to come including other Business Units such as Sales, Purchase, Operations and so on.

Automate vs. standardise

Automation in Power BI can be used to collect and process your data in dashboards. This replaces tasks done by you or your team done manually. 

While standardization ensures that dashboards are consistent and meet certain specifications. You and your team are always working with the same analyses. The standardization avoids that you or your team make your own interpretation. 


Microsoft integration

As a manager within an SME, your job is to facilitate your team to work efficiently. Even more important is the integration of all these tools. If each program stands alone, sooner or later your team will run into problems resulting in frustration: 

  • Excel workbooks can be linked to Power BI dashboards to refresh data automatically.
  • PowerPoint can be used to present Power BI data in professional-looking presentations. Here you can incorporate live data into the slides, even the dashboards are interactive! You’ll learn more about this in this video.
  • Business Central, as a Cloud-based ERP system, can be used to manage and automate business processes. Data from Business Central can be imported into Power BI for analysis and visualization.

The implementation

The Finance Reporting Accelerator comes with a strong standardized base. Yet the package also comes with enough budget to configure some things to suit your business.

P/L structure

The specific items on an income statement can vary from company to company depending on the nature of the business and the type of products or services it offers. So we need to identify these. From your ERP system, we define how your financial data is organized. Then we make sure that your familiar financial reporting structure is reflected in the dashboard

House style

Adding house style to Power BI reports based on terminology and corporate colors can make them more intuitive and familiar to staff, allowing them to better understand the data.

Future proof datamodel

The reports are built on a future proof data model. This was specifically designed to remain flexible and scalable. This allows us to respond to changing business needs. Flexibility for adding new data sources or dimensions is key here.

Features: 

  1. Scalable
  2. Flexible
  3. Clear

The dashboards

Each dashboard provides a new layer of detail or looks at your numbers from a different perspective. In your monthly consultation of dashboards, you’ll know where to look first each time. Sometimes the overview is enough. Other times, certain KPIs require a bit more detailed analysis. Each month, you and your team will get better at crunching the numbers.

Together with our partner in crime Power Partners, we will keep giving you a first look at reports, linkages, and budgeting. The package consists of 6 dashboards in total.

Interested in learning more about our approach?

Microsoft Power Platform

Work together with a platform that does too. 

Select & Start at the Sonical Store.

Start by choosing one, several or all applications.

SWE | Sharing with Externals

Prevent data breaches when sharing confidential information with externals. Sharing documents with externals in Microsoft 365 can be a challenge within your company. Allowing external

Read More »

MDO | Machine Document Office

Need centralized Machine Documentation? As a machine based company, you may have one or multiple document management challenges that affect efficiency and daily operations. Therefore,

Read More »
consultant audit security

Audit & Security

Optimize security & reduce risks when working in Microsoft 365 Microsoft 365 is a comprehensive product with different aspects. Within companies, this is often managed

Read More »
teamwork intranet

Intranet

Stay connected with your company thanks to Intranet. Nowadays we work from different locations, making it more difficult to centralize, keep up with news keep

Read More »
project manager

PMO | Project Management Office

Need centralized project documentation? As a project-based company, you may have one or multiple document management challenges that affect efficiency and daily operations. Therefore, solutions

Read More »

Get inspired during our Events...

Share:

Facebook
Twitter
Pinterest
LinkedIn

Related Posts

Microsoft Inspiration Day 2.0

Preregister now! During our Microsoft Inspiration Day Microsoft and Sonical will write you a symphony. Discover what technologies Microsoft offers within all business processes of